Tariff-driven economic uncertainty led to significantly suppressed sales for the third consecutive month. Continued slow sales and elevated new listings activity helped buoy inventory to the highest level in any month since July 2013.
What does that mean for you?
Buyers: More choices, stronger negotiating power.
Sellers: Pricing and strategy are more important than ever.
Investors: Opportunity to plan ahead as conditions evolve.
Sale Highlights:
Demand in the Vancouver Region was soft for the third consecutive month with 3,130 sales in April. At 36% below the past 10-year April average of 4,897 sales, this was the third-slowest April in available data going back to 2005 (there were 1,773 sales in 2020 and 3,074 in 2019).
Detached home sales were the furthest below average (-53%, to 905), followed by townhomes (-33%, to 633) and condos (-24%, to 1,479).
Sales were down 26% from 4,209 in April 2024. Detached homes were down the most year-over-year (-30%), followed by townhomes (-27%) and condos (-21%).

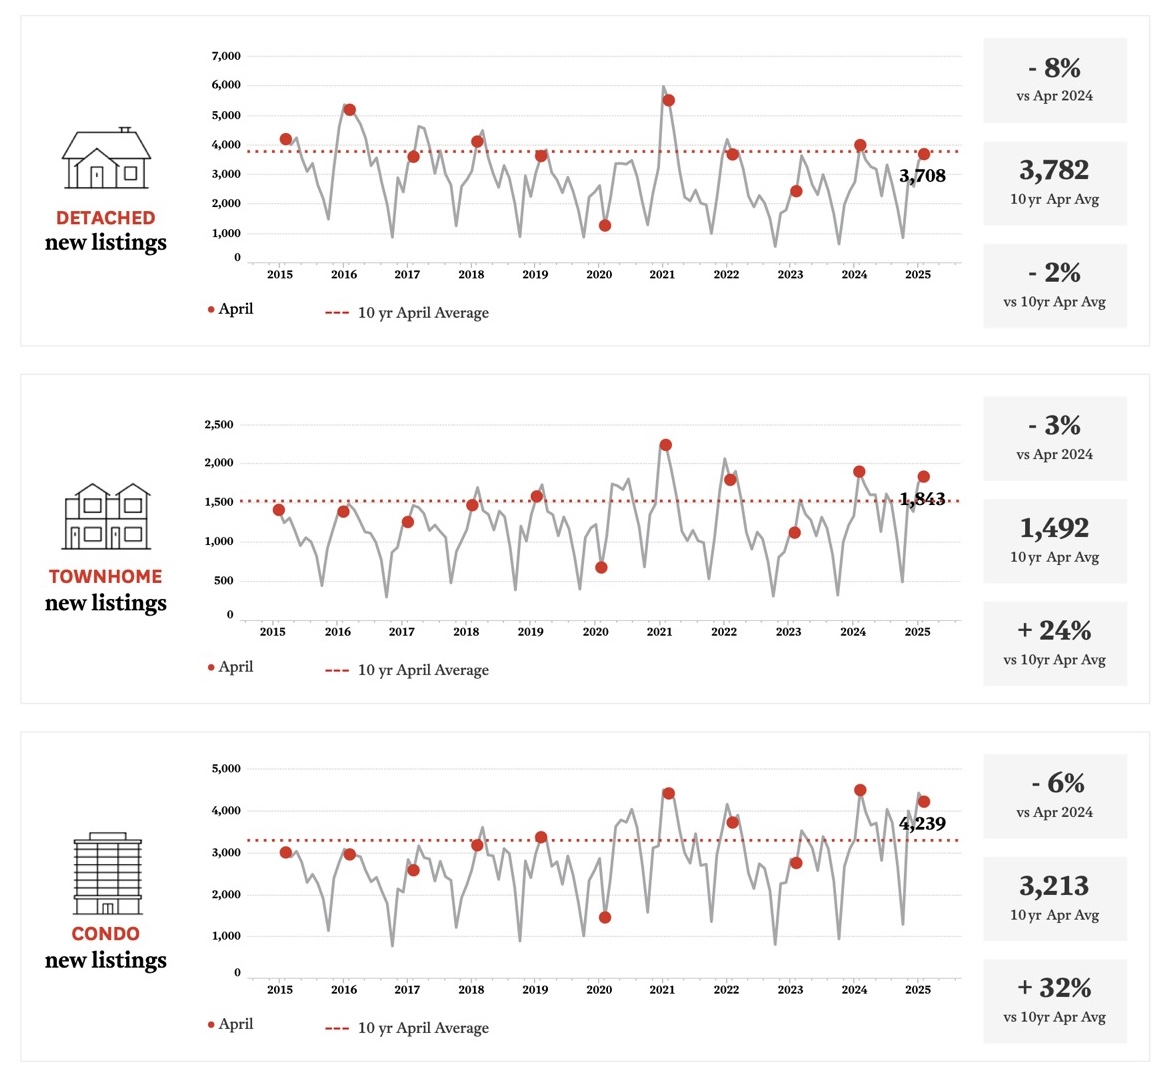
New Listings Highlights:
New listings activity remained robust with 10,178 new homes coming to market in the Vancouver Region in April. This was 18% above the prior 10-year April average of 8,633 new listings.
New condo listings were the furthest above their long-run average (+32%, to 4,239), followed by townhomes (+24%, to 1,843). In contrast, new detached home listings were below average (-2.0%, to 3,708).
On a year-over-year basis, new listings were down 6% from 10,876 in April 2024. New detached home listings were down the most (-8%), followed by condos (-6%) and townhomes (-3%).
Inventory Highlights:
There were 24,225 active MLS listings in the Vancouver Region at the end of April, which was 34% higher than the same time last year (18,021 listings). This was the highest inventory in any month since July 2013 (24,666 listings).
Inventory was 60% higher than the prior 10-year April average of 15,183 listings. Active condo listings were the furthest above average (+82%, to 9,754), followed by townhomes (+73%, to 3,680) and detached homes (+36%, to 9,790).
There were 7.7 months of inventory (MOI) in April, up from 4.3 in April 2024 and the most for the month in 21 years of available data (excluding the pandemic). The detached home segment had an MOI of 10.8 (buyers' market) versus 6.6 for condos and 5.8 for townhomes (balanced markets).

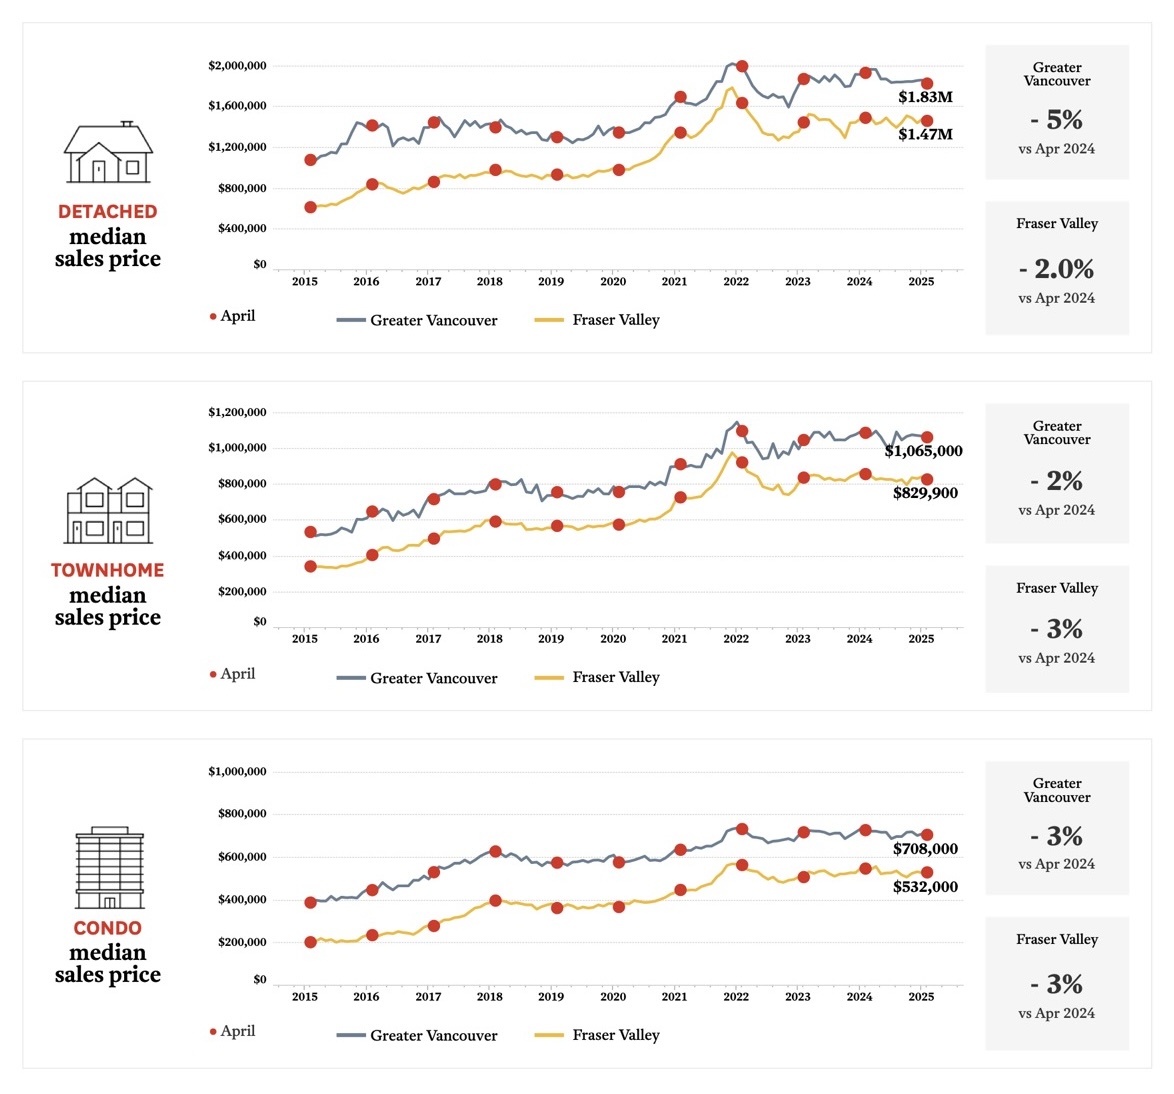
Median Prices Highlights:
On a year-over-year basis, the Greater Vancouver board area saw a decrease of 4% in median sold prices (averaged across home types), while the Fraser Valley experienced a decrease of 3%. In Greater Vancouver, detached home prices were down 5% (to $1.83 million), townhome prices were down 2% (to $1.07 million), and condo prices were down 3% (to $708K). In the Fraser Valley, detached home prices were down 2.0% (to $1.47 million), townhome prices were down 3% (to $830K), and condo prices were down 3% (to $532K).
On a month-over-month basis, median sold prices in Greater Vancouver were down 1.0% (averaged across home types), while in the Fraser Valley they were down 0.8%. In Greater Vancouver, detached home prices were down 1.9%, townhome prices were down 0.7%, and condo prices were down 0.6%. In the Fraser Valley, detached home prices were down 1.0%, townhomes prices were down 1.8%, and condo prices were up 0.4%.